
I made a cool little series of graphs last NBA season showing the scoring per game of the league’s top scorers. I was inspired by the best player on my hometown OKC Thunder, Shai Gilgeous-Alexander, who was having a crazy consistent and high-scoring season. It was a great year for him, and he won the scoring title, but he ultimately came up short of winning the MVP or making a deep run in the playoffs – this year, however, he’s somehow become even more consistent, and it looks like it’s gonna be enough to add another three letters to his name.
Because it’s easy to repeat analyses with R, I decided to re-run the numbers and see just how much he’s elevated his game. We’re gonna repeat our process pretty much exactly: first, we’ll pull the data from the lovely {hoopR} package, then we’ll do some simple summaries and make some graphs. Easy!
library(tidyverse)
library(hoopR)
ds_all <- load_nba_player_box() |>
# This gets rid of the all star game data, which is included for some reason
filter(!str_detect(team_name, "Team"))
# An SGA only dataframe
ds_sga <- ds_all |>
filter(athlete_display_name == "Shai Gilgeous-Alexander")
ds_sga |>
ggplot(aes(x = game_date, y = points)) +
geom_point() +
geom_line() +
scale_y_continuous(limits = c(0, NA)) +
labs(title = "Shai Gilegeous-Alexander: Points Scored per Game",
subtitle = "so far in the 2024-2025 NBA regular season",
x = "Game Date",
y = "Points Scored") +
ggthemes::theme_clean()
Yet again, the most notable thing about this to me is the total absence of bad scoring games. He’s put up less than 20 points one single time this whole season, despite often only playing the first three quarters because his team is playing the other team off the court. This is absolutely crazy and nobody else is even close to that level of consistency right now.
He’s also made one obvious upgrade from last year: 40+ point games. Last year he only hit that mark five times, and his season / career high was just 44, which is kinda surprisingly low for an MVP caliber player. This year, especially since the All Star break, he’s exploded past that “ceiling” and put up a total of twelve 40+ point games. He also blew through his previous career high in six of those games to set a new high of 54 – and again, this is happening in spite of the fact that the Thunder are even better than last year, and have been putting away their opponents in three quarters as often as not.
OK, just like last year, let’s now compare his numbers to the other top scorers in the league. I’m gonna start by filtering our data to only include the top 12 players in the league by the number of 30+ point games they’ve put up this year, excluding games where they didn’t start:
top_twelve_guys <- ds_all |>
group_by(athlete_display_name) |>
summarize(
n_over_30 = sum(points >= 30, na.rm = T),
p_over_30 = n_over_30 / n(),
p_over_30 = paste0("(", round(100 * p_over_30, 2), "%)"),
total_points = sum(points, na.rm = T),
avg_points = total_points / n(),
) |>
arrange(desc(n_over_30)) |>
slice_max(order_by = n_over_30, n = 12)
top_twelve_guys |>
mutate(
avg_points = round(avg_points, 2),
total_points = format(total_points, big.mark = ",")
) |>
janitor::clean_names("title") |>
knitr::kable()| Athlete Display Name | N over 30 | P over 30 | Total Points | Avg Points |
|---|---|---|---|---|
| Shai Gilgeous-Alexander | 44 | (62.86%) | 2,253 | 32.19 |
| Giannis Antetokounmpo | 34 | (54.84%) | 1,810 | 29.19 |
| Jayson Tatum | 27 | (39.13%) | 1,791 | 25.96 |
| Nikola Jokic | 26 | (41.94%) | 1,806 | 29.13 |
| Anthony Edwards | 22 | (30.99%) | 1,912 | 26.93 |
| Devin Booker | 22 | (33.33%) | 1,696 | 25.70 |
| Jalen Brunson | 22 | (35.48%) | 1,606 | 25.90 |
| Tyrese Maxey | 22 | (33.85%) | 1,369 | 21.06 |
| Cade Cunningham | 20 | (28.99%) | 1,698 | 24.61 |
| Kevin Durant | 20 | (33.9%) | 1,583 | 26.83 |
| Luka Doncic | 20 | (50%) | 1,109 | 27.73 |
| Trae Young | 20 | (29.85%) | 1,593 | 23.78 |
Just like last year, SGA is in the lead with 44 games above the 30 point mark, which is 10 more than Giannis, the runner up. This is more interesting to me in graph form again, though, so let’s check this out in visual form. I’m curious about 20+ point games and 30+ point games, so let’s set it up so that the 20+ point zone is dark red, and the 30+ point zone is lighter red. That way, we can see how often each player stays above those “floors”.
ds_all |>
filter(athlete_display_name %in% top_twelve_guys$athlete_display_name,
starter == TRUE) |>
ggplot(aes(x = game_date, y = points)) +
geom_point() +
geom_line() +
geom_label(data = top_twelve_guys,
aes(label = paste0("Total: ", n_over_30, " ", p_over_30),
x = ymd("2024-12-1"),
y = 70),
fontface = "bold") +
geom_rect(ymin = 0, ymax = 30, xmin = min(ds_all$game_date), xmax = max(ds_all$game_date),
fill = "red", alpha = 0.005) +
geom_rect(ymin = 0, ymax = 20, xmin = min(ds_all$game_date), xmax = max(ds_all$game_date),
fill = "red", alpha = 0.01) +
scale_y_continuous(limits = c(0, 75)) +
facet_wrap(~factor(athlete_display_name, levels = top_twelve_guys$athlete_display_name)) +
labs(title = "Total Games with 20/30+ Points",
subtitle = "so far in the 2024-2025 NBA regular season",
x = "Game Date",
y = "Points Scored",
caption = paste("As of", today())) +
ggthemes::theme_clean()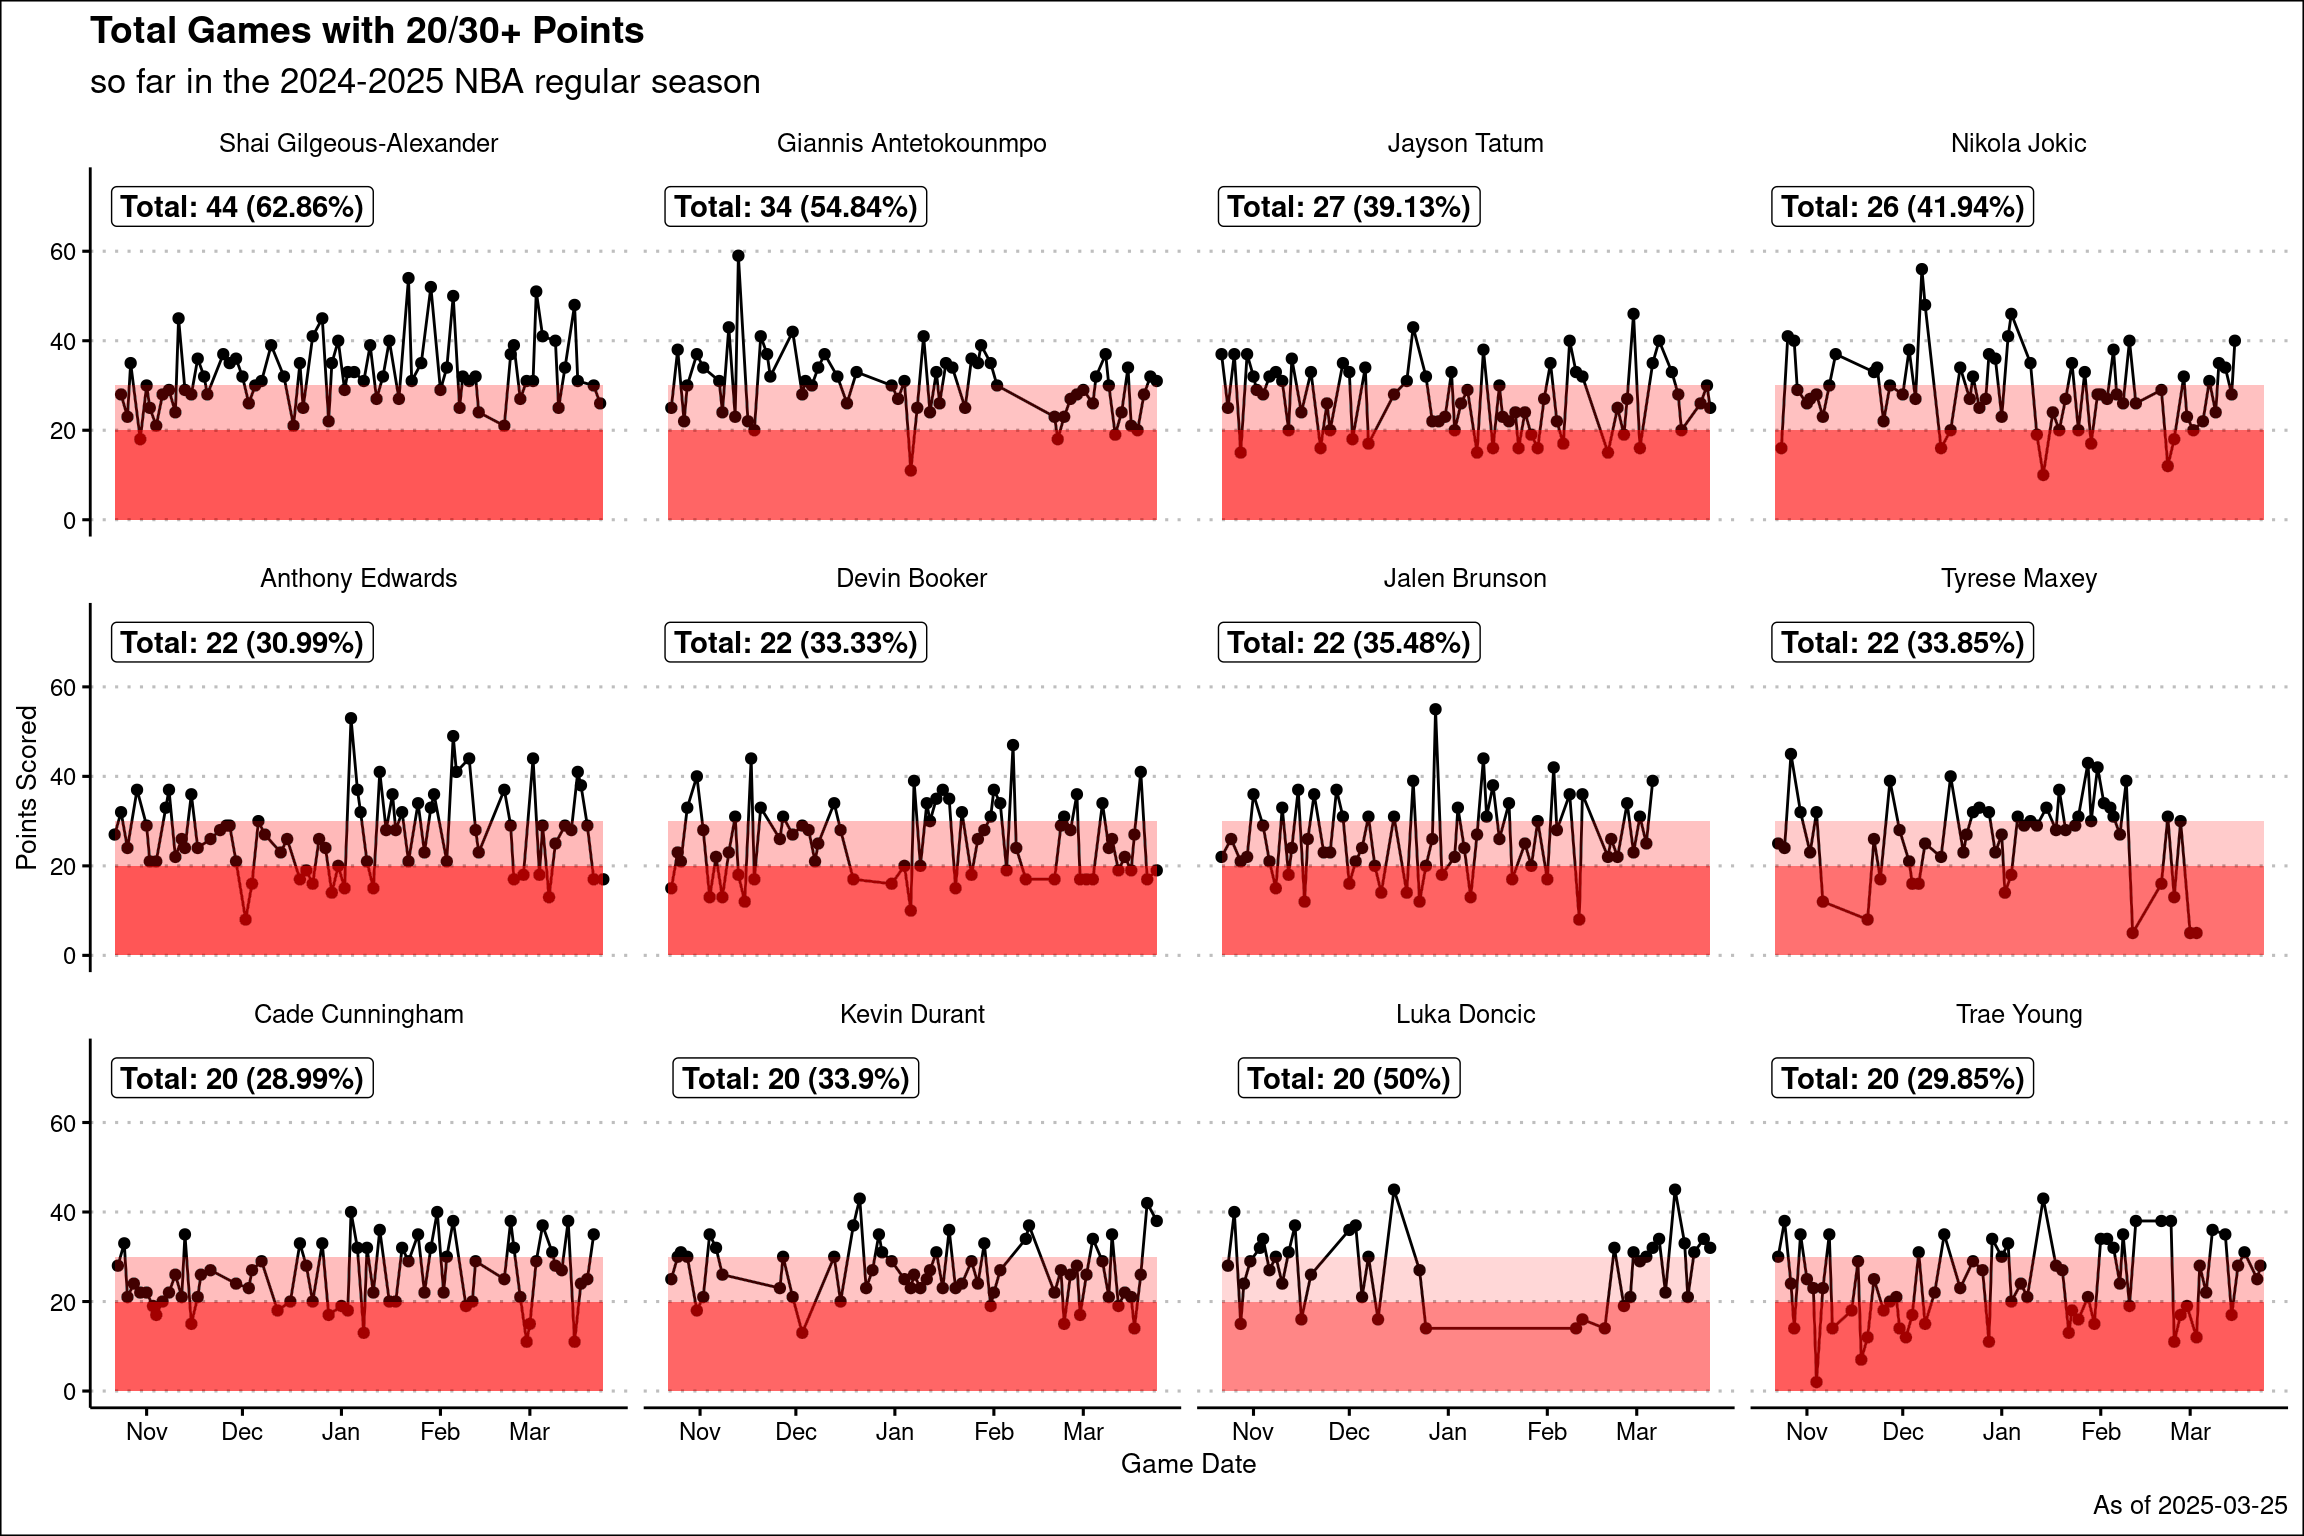
Again: what a nice looking graph! SGA only dips down into that dark red zone one time, early on in the season in a game against the Spurs in October. Since then, the 20 point floor has held strong, and the majority of his games have also been above the 30 point mark.
Giannis also does a great job of being consistent and staying out of the dark red. My fellow OU alum Trae Young also has an interesting graph – he’s kind of the anti-SGA, in the sense that he can either put up a 40 piece or totally disappear depending on the game. He’s doing a lot of stuff outside of scoring, which explains a lot of that though. These charts help kind of paint a picture of each person’s playstyle and contributions.
Anyway, SGA is good and should be the MVP. Thanks for reading!