
I was always more of a college basketball guy, growing up as I did in Lawrence, Kansas. But in recent years I’ve been becoming more of an NBA head, largely because I now have a hometown team in the Oklahoma City Thunder. This has been made easier by the fact that the Thunder have been really fun to watch lately – they’re currently in contention for the first seed in the brutal Western Conference, and are probably a consensus top-4 team in the NBA at least, as of the time I wrote this.
If you know anything about OKC, you know that their main guy is Shai Gilgeous-Alexander, A.K.A. SGA, who is hoping to add another three-letter acronym to his collection in the MVP race this year. He’s real good at scoring points, and a lot of other things, but I was inspired to make a graph by one particular quirk of his scoring: how unusually consistent it is. For example, as I write this in late February, his most common point total of 31 is enough to earn him the record for “most games scoring exactly 31 points during the regular” in NBA history, even though there’s still two months left.
Check out this graph of his performances so far this regular season. We’re gonna pull the data from {hoopR}, which makes this trivial. I’m not even gonna explain what’s happening here – you already know what it is.
library(tidyverse)
library(hoopR)
ds_all <- load_nba_player_box()
ds_sga <- ds_all |>
filter(athlete_display_name == "Shai Gilgeous-Alexander")
ds_sga |>
ggplot(aes(x = game_date, y = points)) +
geom_point() +
geom_line() +
scale_y_continuous(limits = c(0, NA)) +
labs(title = "Shai Gilegeous-Alexander: Points Scored per Game",
subtitle = "so far in the 2023-2024 NBA regular season",
x = "Game Date",
y = "Points Scored") +
ggthemes::theme_clean()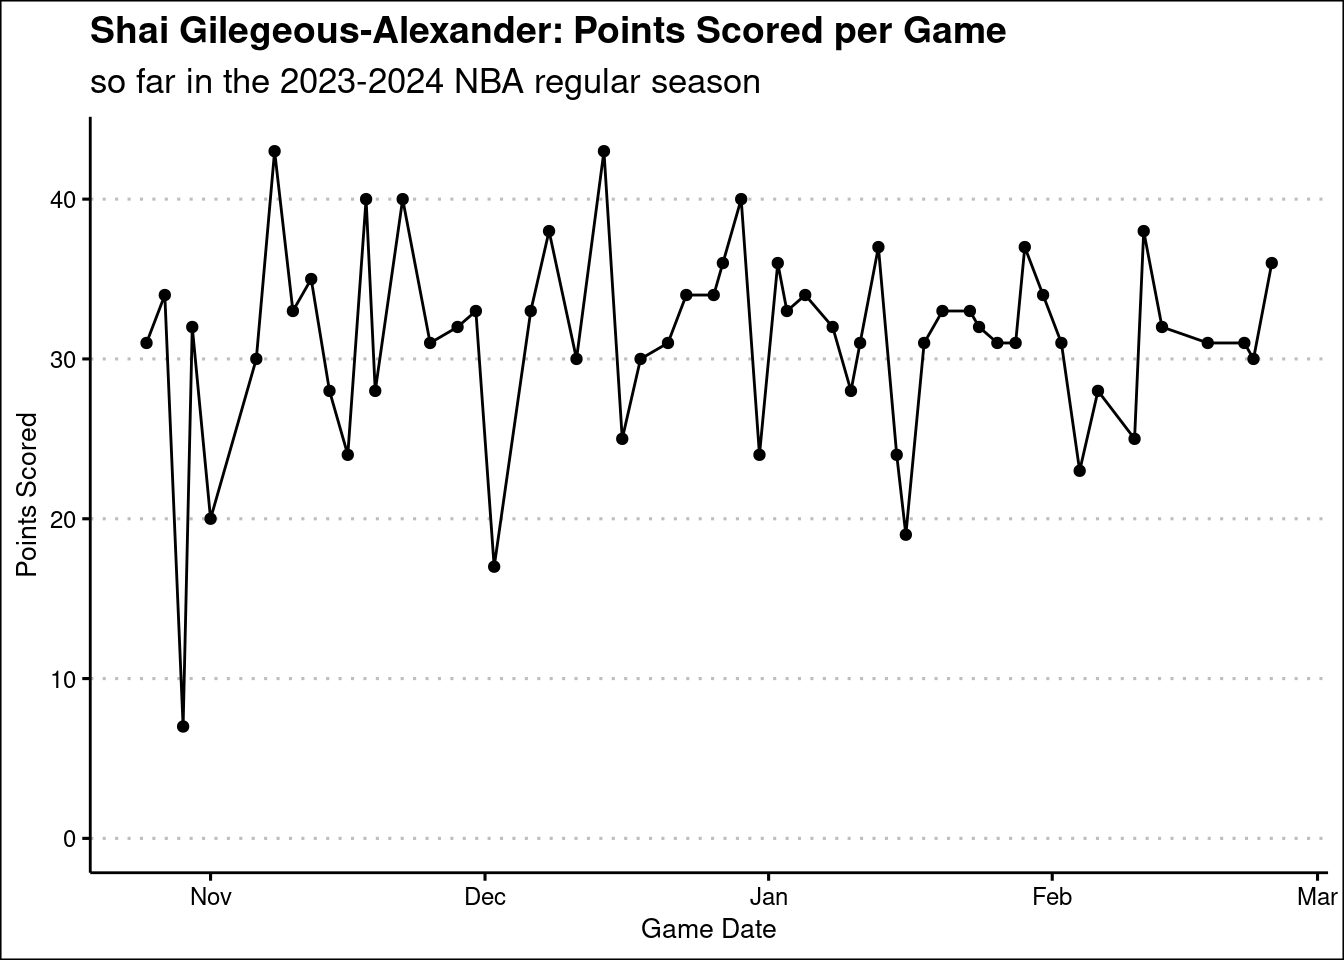
Now, obviously he scores a lot of points. But there are two particularly interesting things about this, to me:
The first is that he also doesn’t ever score a lot of points. His career/season high is currently 44, which is really not all that much for a guard in the NBA. Luka Doncic and Joel Embiid are dropping 70+, and it’s not uncommon to see even second or third option guys go off for 50+ every so often.
But SGA never does. Instead, he puts up between 30 and 40 points with such ridiculous consistency that he’s in first place in overall scoring and second only to Luka in per-game scoring anyway.
The second thing is that it’s rare that he puts him fewer than 30, and very rare that he scores less than 20 – he’s only done that 3 times in 57 games.
Given his remarkably solid “floor” of 30 points, I was curious to see how other players’ consistency compares.
First, let’s use the {hoopR} data to see the top 12 scorers and their record against the 30-point floor. I’ll sort the table by the total number of 30+ point games each player has had so far.
my_guys <- ds_all |>
group_by(athlete_display_name) |>
summarize(
n_over_30 = sum(points >= 30),
p_over_30 = n_over_30 / n(),
p_over_30 = paste0("(", round(100 * p_over_30, 2), "%)"),
total_points = sum(points),
avg_points = total_points / n(),
) |>
arrange(desc(n_over_30)) |>
slice_max(order_by = n_over_30, n = 12)
my_guys |>
mutate(
avg_points = round(avg_points, 2),
total_points = format(total_points, big.mark = ",")
) |>
janitor::clean_names("title") |>
knitr::kable()| Athlete Display Name | N over 30 | P over 30 | Total Points | Avg Points |
|---|---|---|---|---|
| Shai Gilgeous-Alexander | 43 | (75.44%) | 1,777 | 31.18 |
| Luka Doncic | 37 | (74%) | 1,687 | 33.74 |
| Giannis Antetokounmpo | 34 | (59.65%) | 1,748 | 30.67 |
| Stephen Curry | 23 | (42.59%) | 1,484 | 27.48 |
| Trae Young | 22 | (42.31%) | 1,349 | 25.94 |
| Anthony Edwards | 21 | (38.18%) | 1,426 | 25.93 |
| De’Aaron Fox | 20 | (40%) | 1,345 | 26.90 |
| Donovan Mitchell | 19 | (41.3%) | 1,274 | 27.70 |
| Devin Booker | 18 | (36.73%) | 1,333 | 27.20 |
| Nikola Jokic | 18 | (31.58%) | 1,477 | 25.91 |
| Kawhi Leonard | 13 | (25%) | 1,225 | 23.56 |
| Jaylen Brown | 12 | (22.64%) | 1,186 | 22.38 |
SGA is in the lead by a pretty fair margin of 6, beating the 30-point floor in over 75% of his games! Luka’s handful of monster games and slightly smaller number of overall games are what put him over the top in per-game scoring. Giannis is really the only other guy in that 50%+ tier as well.
Let’s go ahead and make a fun graph and then I’ll probably mosey on out of here.
ds_all |>
filter(athlete_display_name %in% my_guys$athlete_display_name) |>
ggplot(aes(x = game_date, y = points)) +
geom_point() +
geom_line() +
geom_label(data = my_guys,
aes(label = paste0("Total: ", n_over_30, " ", p_over_30),
x = ymd("2023-12-1"),
y = 60),
fontface = "bold") +
geom_rect(ymin = 0, ymax = 30, xmin = min(ds_all$game_date), xmax = max(ds_all$game_date),
fill = "red", alpha = 0.01) +
scale_y_continuous(limits = c(0, NA)) +
facet_wrap(~factor(athlete_display_name, levels = my_guys$athlete_display_name)) +
labs(title = "Total Games with 30+ Points",
subtitle = "so far in the 2023-2024 NBA regular season",
x = "Game Date",
y = "Points Scored",
caption = paste("As of", today())) +
ggthemes::theme_clean()
What a nice looking graph! I love how Luka’s line spikes up in a way that frames the labels nicely. And the thing I really wanted to see at the beginning of all this was that SGA line almost skipping off the surface of the 30-point floor. Neat!