
Intro: College basketball Reddit game threads
“wow worst refs i’ve ever seen in my life”
– someone, every single game thread ever made
Reddit is a bad website you can go to if you want to waste some of the precious, distressingly finite time you have on earth. I, apparantly, want this on a fairly consistent basis, and this time of year, one of my favorite places to do it is reddit’s college basketball forum, /r/CollegeBasketball. There’s lots of stupid, low-stakes sports arguments, dumb jokes, mockery, and scorn, which can be a lot of fun at times. Especially compared to the rest of the website, which makes /r/CBB look like an enlightened paradise.
Big games are accompanied by a live game thread on /r/CBB, where users can post their thoughts and reactions in real time as the action unfolds. They’re pretty popular too – bigger matchups can draw tens of thousands of comments to a single thread. It’s kind of neat seeing how the different fanbases (distinguished by the users’ flairs) feel about the game in real time, but if you poke your head into one – particularly a close, important game between two teams with lots of fans – you’ll quickly realize that they can also get pretty nasty. This is especially true when it comes to the referees; in fact, complaining about the refs often becomes the predominant theme of the thread.

More than anything, though, these threads are a juicy source of interesting data to dig into! So I put my R skills to the test to see what I could learn about reddit college basketball fans, a population in dire need of empirical study.
Throughout this year’s tournament, which recently concluded, I’ve been scraping all the comments from every /r/CBB game thread using the PRAW Python wrapper for Reddit’s API, and then analyzing them with our very good friend, the R statistical programming language.. So, without further ado, here’s (more or less) what I did and how I did it!
Part 1: an abridged guide to scraping reddit data with PRAW
I’ll start with how I got the data.
Normally I like to use R for most things, since it’s what I’m most familiar with. However, there are some rare times when I have to turn to Python for one reason or another, and this is one of them. There just aren’t any good Reddit scraping solutions in R – none of them have a way to easily scrape the entire contents of a big thread, since it’s kind of cumbersome to get over 1,000 or so comments at once with the way Reddit’s API works. I was only able to get PRAW for Python to do it right (and even then, it takes forever).
Here’s the Python script I ended up writing and using. I actually wrapped it in an R function and integrated it into my sportsBS R “package” that I use to keep all my code at least marginally organized. So this script is doing all the actual scraping and then storing the results in the local environment; my wrapper function then stores the data on the hard drive.
import praw
import csv
import time
from datetime import date
import pandas as pd

chosen_url = r.thread_url # r is the current R environment via {reticulate}
current_date = date.today().strftime('%b-%d-%Y')

reddit = praw.Reddit(
    client_id=r.client_id, # these are secrets!
    client_secret=r.secret, # I'm storing them in my .Renvironment file!
    user_agent='your_agent', # shhhhhh!
)

submission = reddit.submission(url = chosen_url)

n_comments = submission.num_comments

# This loops through and basically hits "load more" on the comment board,
# until there are no comments left.
while True:
      try:
          submission.comments.replace_more(limit=None)
          break
      except:
          print('Handling replace_more exception') # Handles exceptions
          time.sleep(0.1)

comments = submission.comments.list()

# This part pulls all the info into a tidy table
df = pd.DataFrame()
name = "NULL"
for comment in comments:
  auth = comment.author
  if auth != None:
    name = auth.name
  a = pd.DataFrame([[submission.title, comment.body, name,
      comment.author_flair_text, comment.created_utc, comment.score]])
  df = pd.concat([df, a])

final = df.rename(columns = {0: 'title', 1: 'body', 2: 'author', 3: 'flair',
                             4: 'time_unix', 5: 'score'})

# This `final` dataframe is then available in my R environment / wrapper function.
I might go into more detail on this whole setup later, but it effectively means that all I need to do to scrape and save a thread’s comments is run this function in my R console:
sportsBs::scrape_reddit_thread(
  url = "https://old.reddit.com/r/CollegeBasketball/comments/11u4z1g/game_thread_16_fairleigh_dickinson_1_purdue_0650/",
  save_locally = TRUE,
  save_local_directory = "my/directory/"
)
Nice and convenient! I scraped each of the 67 total game threads from the First Four to the National Championship using this method. It took quite a while (like I said, some of those big, 10k+ comment threads can take literal hours), but the end result was about 63MB worth of something incredibly valuable and worthwhile: reddit users’ thoughts. How richly have our efforts been rewarded! Now it’s time to analyze and visualize!
Part 2: Analyzing for whininess, etc.
Wrangling and looking for ref complaints
There are a lot of ways you could go about flagging these comments as ref complaints, but I chose the simplest one. None of that fancy AI, machine learning, latte-frappuccino, coastal limousine elite crap here – just good, reliable ol’ regex.
I just searched each comment for flags like “refs”, “rigged”, “bullshit call”, “refball”, etc. that usually indicate a ref complaint. This isn’t perfect, because it will include false positives like the rare “the refs are doing a great job!” and exclude contextual / non-flagged things like “that’s bullshit”, but it gets pretty close.
Here’s the full list of terms I searched (the regex isn’t very elegant, and I could probably improve it a lot, but I won’t because I actually hate regex. It does well enough):
"REF | REFS|REFS |REFFING|REFEREE|OFFICIAL|OFFICIATING|OFFICIATED|
|REFBALL|RIGGED|RIGGING|THE FIX|WHISTLE|FUCKING CALL|DAMN CALL|
|TERRIBLE CALL|BAD CALL|BULLSHIT CALL|AWFUL CALL|HOSED|ROBBED|JOBBED"
I also had to do a lot of manual cleaning / wrangling to get the raw comment data into the format we’ve just loaded up. Here’s the full R code I used to clean up the raw comment data, as saved by PRAW:
# all_data is the raw PRAW results
comments_clean <- all_data |>
  mutate(
    time = as_datetime(time_unix), # translating time into a useable format
    ref_complaint = if_else(grepl(
      " REF | REFS|REFS |REFFING|REFEREE|OFFICIAL|OFFICIATING|OFFICIATED|
      |REFBALL|RIGGED|RIGGING|THE FIX|WHISTLE|FUCKING CALL|DAMN CALL|
      |TERRIBLE CALL|BAD CALL|BULLSHIT CALL|AWFUL CALL|HOSED|ROBBED|JOBBED",
      body, ignore.case = TRUE), # do ref flags appear in the body?
      TRUE, FALSE),
    flair = trimws(str_remove(flair, "\\:[^()]*\\:")), # wrangling flairs
    flair = if_else(flair == "NULL", "No Flair", flair)
  ) |>
  separate(col = flair, sep = " • ", into = c("flair_one", "flair_two")) |>
  # pulling out home and away team names
  separate(col = title, sep = " (@|defeats) ", into = c("away", "home"), remove = FALSE) |>
  mutate(
    away = str_remove(away, "\\[Game Thread]"),
    away = trimws(str_replace_all(away, pattern = "[^a-zA-Z ]", "")),
    home = str_remove(home, " \\s*\\([^\\)]+\\)"),
    home = trimws(str_replace_all(home, pattern = "[^a-zA-Z ]", "")),
  ) |>
  group_by(title) |>
  mutate(
    faction = case_when(
      grepl(home, flair_one) ~ "Home Team Fan",
      grepl(away, flair_one) ~ "Away Team Fan",
      TRUE ~ "Neutral / Both / Neither"
    ),
    flair_one = if_else(is.na(flair_one), "No Flair", flair_one),
    title_clean = str_replace_all(title, "\\[Game Thread\\]", ""),
    title_clean = str_replace(title_clean, "\\s*\\([^\\)]+\\)", "") |> trimws(),
  ) |>
  ungroup()
That’s a pretty gnarly chunk of code, but most of what it’s doing is just a long series of simple text analysis tasks. The end result is our current dataset, comments_clean.
Peeking at the data
To start our analysis, let’s load in the now-clean dataset and see how many total comments there were.
library(readr)
library(dplyr)

comments_clean <- read_rds("./data/full-r-cbb-comment-data-2023-ncaa-tournament.rds")

nrow(comments_clean) |>
  format(big.mark = ",")
## [1] "219,585"Wow, there’re over 200,000 of the durn things! Now let’s see what kind of variables we have to work with.
comments_clean |>
  names()
## [1] "title" "away" "home" "body"
## [5] "author" "flair_one" "flair_two" "time_unix"
## [9] "score" "time" "ref_complaint" "faction"
## [13] "title_clean"Alright, so for each comment, we’ve got:
The thread title,
The home and away team names,
The comment’s body and author,
The author’s flairs (denoting fandom),
The time the comment was made and its score at the time of scraping,
ref_complaint, which isTRUEwhen a ref flag was found andFALSEotherwise, andfaction, which says whether the commentor is a home team fan, away team fan, or neutral observer based on their flairs and the thread title.
There’s also one called title_clean, but that’s just a cleaned up version of the thread title that we can use in our visualizations later. Cool – now we’ve got a nice tidy dataset to work with. It’s time to get to visualizin’!
Part 3: Tables n’ Charts
3.1 | Measuring ref complaints per comment
Let’s start with the main event and look at which thread had the most ref complaints on a per-comment basis. Perhaps for now, we can naively assume that reddit commentators are even-handed, and that their complaints generally track with the quality of the officiating in each particular game. Get ready, because this ggplot is a bit of a doozy:
library(ggplot2)

# First, let's get our data re-summarized in terms of threads, not comments
graph_data <- comments_clean |>
  group_by(title = title_clean, faction) |>
  summarize(
    n_complaints = sum(ref_complaint, na.rm = T),
    n_comments = n(),
  ) |>
  group_by(title) |>
  mutate(
    total_comments = sum(n_comments, na.rm = T),
    total_complaints = sum(n_complaints, na.rm = T),
    p_complaints = n_complaints / total_comments,
    sum_p_complaints = total_complaints / total_comments,
  ) |>
  ungroup()

# This graph requires some additional data to set up the labels
label_data <- graph_data |>
  group_by(title) |>
  summarize(
    sum_comments = unique(total_comments),
    sum_complaints = unique(total_complaints),
    sum_p_complaints = total_complaints / total_comments
  ) |>
  distinct()

# Finally, the ggplot itself
ggplot(data = graph_data,
       aes(x = reorder(title, sum_p_complaints),
           y = p_complaints)) +
  geom_col(aes(fill = as.factor(faction))) +
  geom_text(data = label_data,
            aes(x = reorder(title, sum_p_complaints),
                y = sum_p_complaints,
                label = paste0(format(sum_complaints, big.mark = ","), " complaints / ", format(sum_comments, big.mark = ","), " comments = ", round(100 * sum_p_complaints, 1), "%")),
            position = "stack",
            hjust = -0.05) +
  coord_flip() +
  labs(
    title = "r/CollegeBasketball Game Threads\nby Proportion of Comments Complaining About the Refs",
    subtitle = "Entire 2023 Tournament",
    y = "% of Comments Featuring a Remark About the Refs",
    x = "",
    fill = "Complainer Flair",
    caption = paste0("Data collected from r/CollegeBasketball using PRAW (https://praw.readthedocs.io/en/stable/)\n",
                     "Allegiance determined by primary flairs only")
  ) +
  ggthemes::theme_fivethirtyeight() +
  scale_fill_manual(labels = c("Away Team Fan", "Home Team Fan", "Neutral / No Flair"),
                    values = c("#008FD5", "#FF2700", "#A8A8A8")) +
  scale_y_continuous(labels = scales::percent, limits = c(0, 0.23)) +
  theme(
    axis.text.y = element_text(size = 13),
    axis.title = element_text(),
    plot.title.position = "plot",
    plot.title = element_text(hjust = 0.5),
    plot.subtitle = element_text(hjust = 0.5)
  )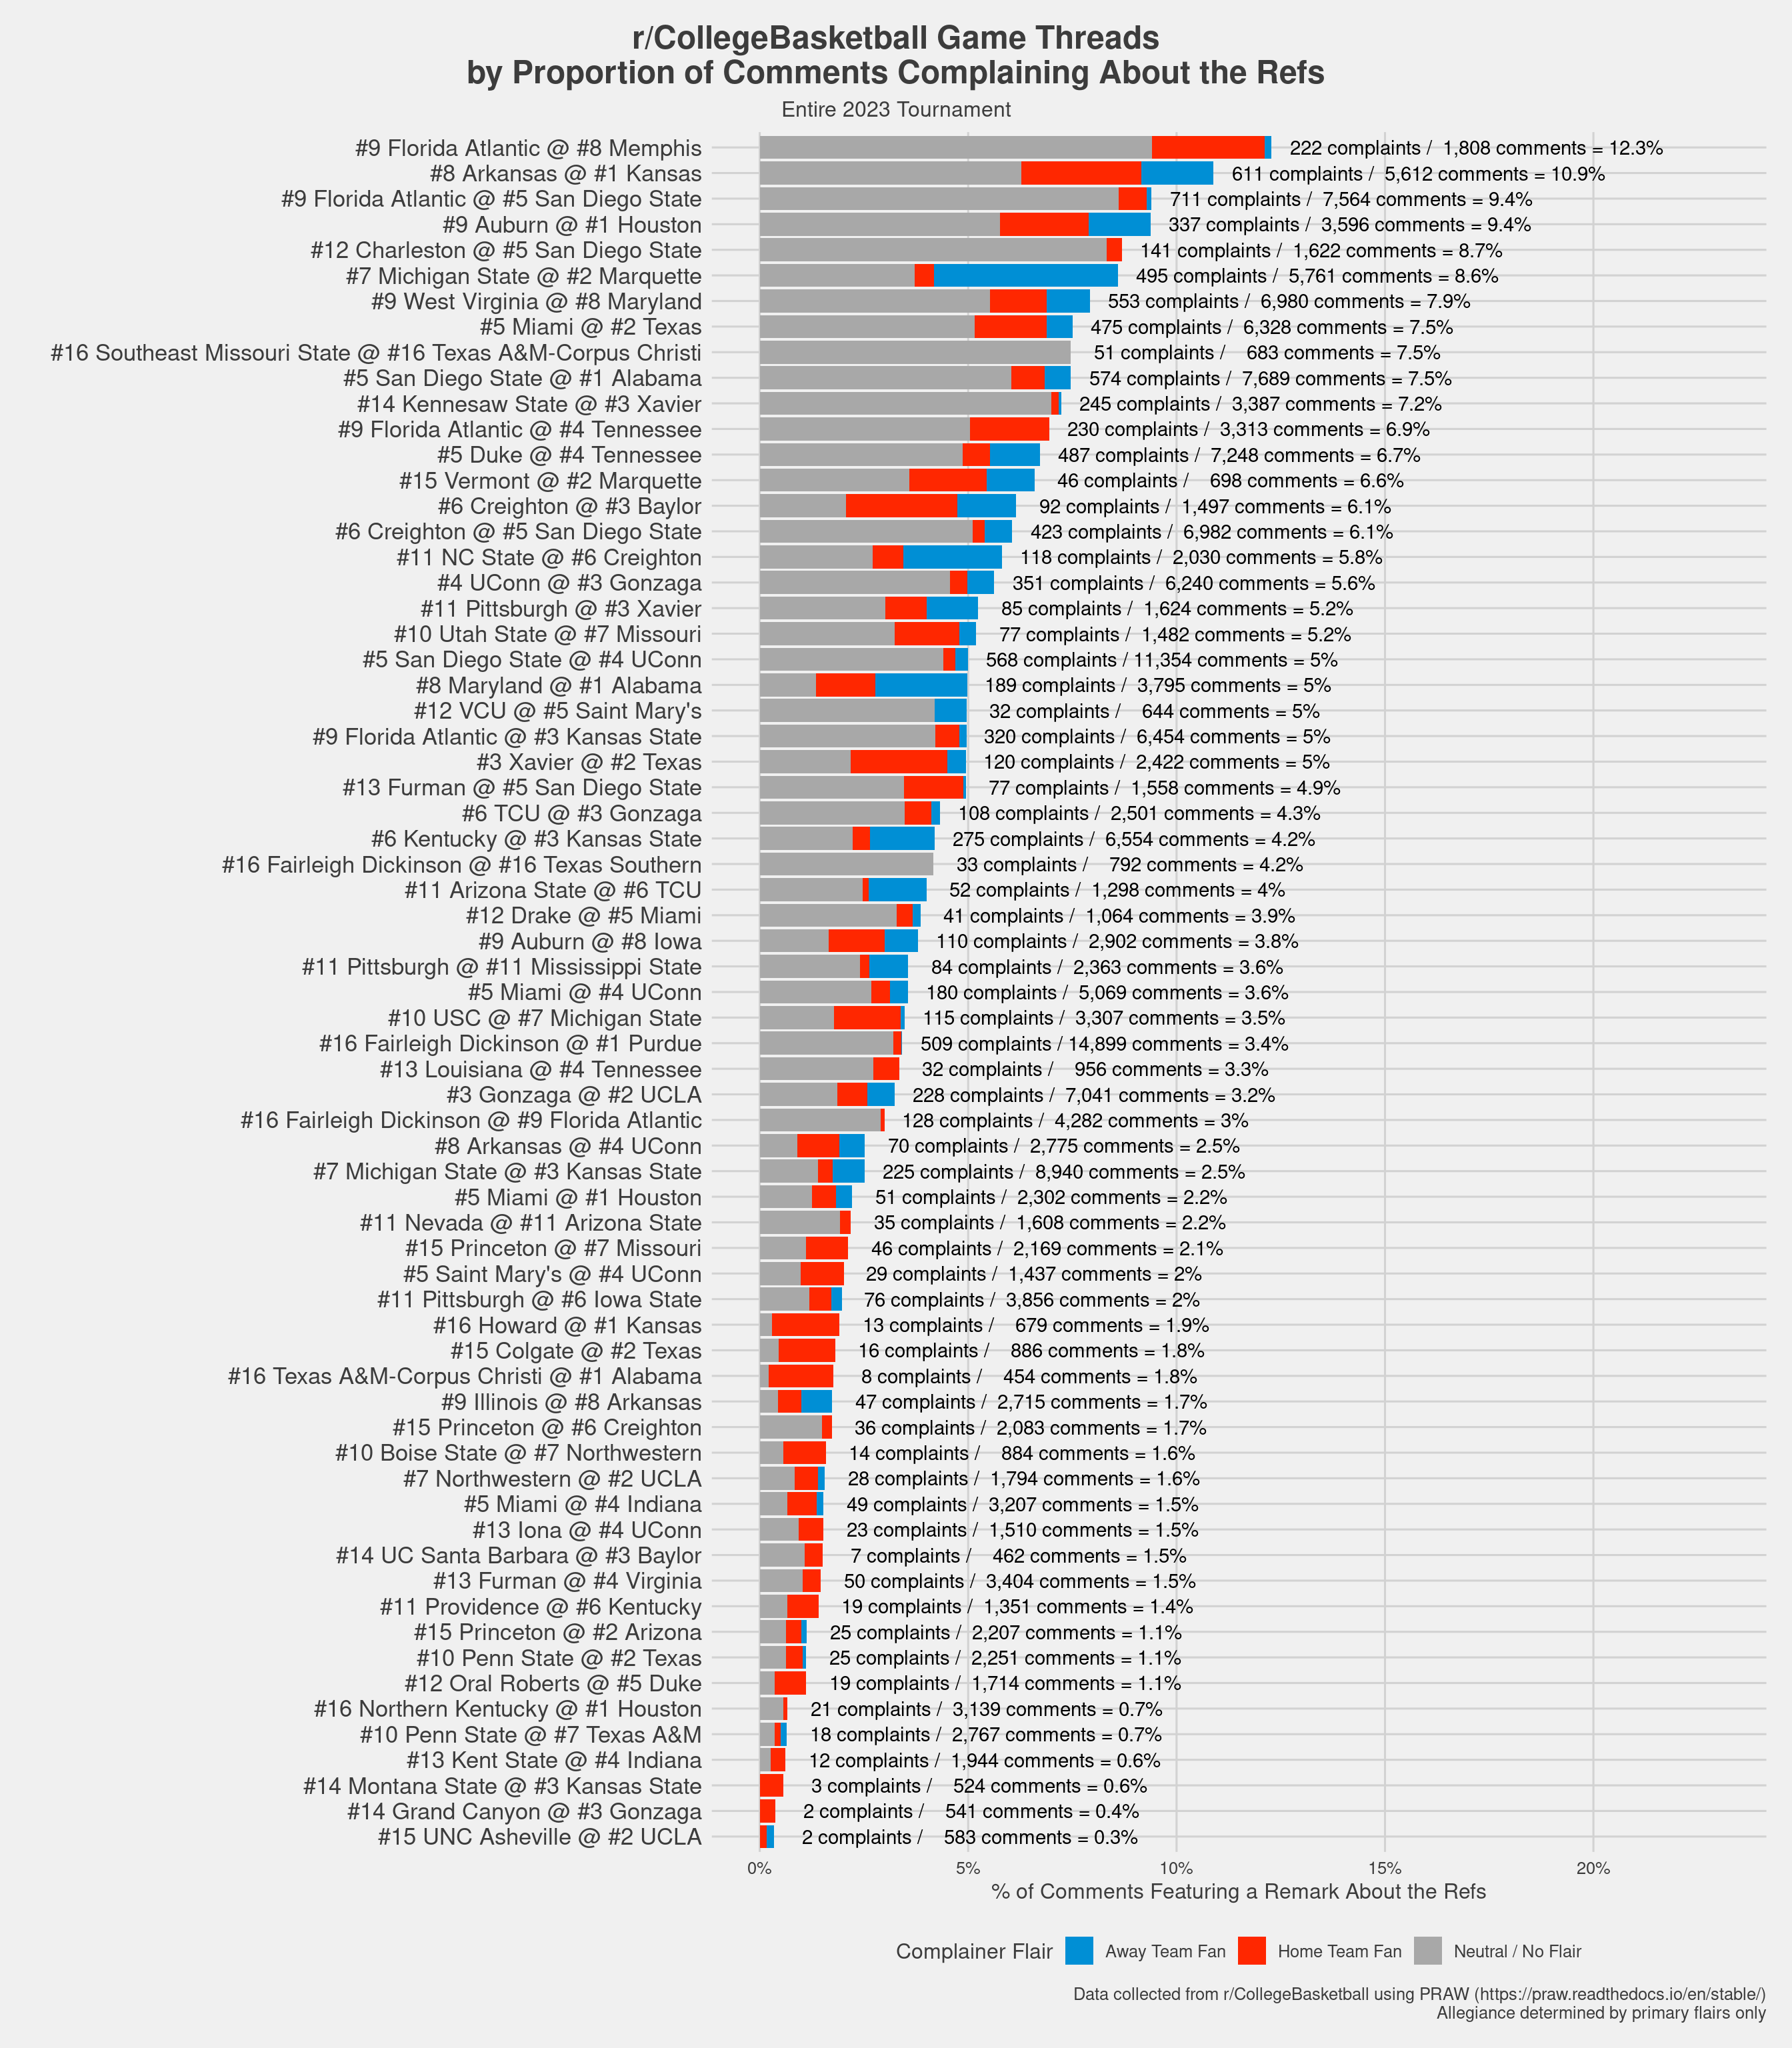
By a pretty sizeable margin, FAU vs. Memphis all the way back in round 1 was the most angry at the refs – about 12.3% of all comments featured a remark about the officiating, enough to warrant a rating of “spicy!” on the very empirical and serious scale I’ve been developing. This is interesting to me, because this was actually one of the more pivotal games in the tournament given how far FAU ended up going / how wide open that region became.
KU vs. Arkanasas takes #2 (not particularly surprising; it’s entirely possible I contributed to that as well lol), and FAU vs. SDSU takes third. FAU actually winds up near the top of this list a lot which, again, is kind of interesting.
In any case, pretty cool! There’s all kinds of other analyses we could do with this data as well – for example, let’s see which fan base (flair) complained the most:
library(kableExtra)

comments_clean |>
  group_by(flair_one) |>
  summarize(
    n_comments = n(),
    n_ref_complaints = sum(ref_complaint), # how many total complaints?
    p_ref_complaints = 100 * n_ref_complaints / n_comments
    ) |>
  filter(n_comments > 500) |> # Limit to only flairs w/ a tleast 500 comments
  slice_max(order_by = p_ref_complaints, n = 10) |> # top 10 only
  mutate(
    across(.cols = !flair_one,
           .fns = ~format(round(.x, 2), big.mark = ",")),
    rank = paste0("#", row_number()), # adding rankings
    p_ref_complaints = paste0(p_ref_complaints, "%")
  ) |>
  select("Rank" = rank,
         "Primary Flair" = flair_one,
         "Total Comments" = n_comments,
         "N Comments w/ ref complaints" = n_ref_complaints,
         "% Comments w/ ref complaints" = p_ref_complaints) |>
kable()| Rank | Primary Flair | Total Comments | N Comments w/ ref complaints | % Comments w/ ref complaints |
|---|---|---|---|---|
| #1 | Memphis Tigers | 801 | 94 | 11.74% |
| #2 | West Virginia Mountaineers | 1,660 | 143 | 8.61% |
| #3 | Baylor Bears | 1,330 | 92 | 6.92% |
| #4 | Virginia Tech Hokies | 876 | 60 | 6.85% |
| #5 | Buffalo Bulls | 548 | 36 | 6.57% |
| #6 | Marquette Golden Eagles | 1,508 | 98 | 6.50% |
| #7 | Louisville Cardinals | 1,174 | 73 | 6.22% |
| #8 | No Flair | 34,230 | 2,117 | 6.18% |
| #9 | Georgia Bulldogs | 617 | 38 | 6.16% |
| #10 | Notre Dame Fighting Irish | 586 | 36 | 6.14% |
The ref complaining champs of 2023 are the Memphis Tigers, who locked in their title with their chart-topping game against FAU in round one. WVU fans came in second (their tough loss to Maryland was one of the very first games broadcast, so I think we can chalk some of it up to people getting caught up in early tournament excitement), and Baylor fans came in third. Interestingly, the hated No Flairs only finished at #8, just above the Georgia Bulldogs who are also here for some reason. Get outta here Georgia, it’s not football season yet!
With even more data, you could also do some cool models with this stuff. For example, do certain kinds of games (certain timeslots, close games, certain teams / conferences, etc.) lead to more / less complaints? What about certain officiating crews? I’ll include the data at the bottom of this post, so if you want, you can go look into that for yourself.
3.2 | Game thread timelines
I split each game thread up into five minute chunks, and counted the number of comments made during each interval from each faction. This results in fun little timeline graphs that show you where the action / excitement spiked, what % of each thread was made up of neutrals, etc. I think they’re neat, so here is a selection of some of the 2023 touranment’s most notable games:
selected_games <- comments_clean |>
  count(title) |>
  filter(title %in% c("[Game Thread] #5 San Diego State @ #4 UConn (09:20 PM ET)",
                      "[Game Thread] #16 Fairleigh Dickinson @ #1 Purdue (06:50 PM ET)",
                      "[Game Thread] #7 Michigan State @ #3 Kansas State (06:30 PM ET)",
                      "[Game Thread] #5 San Diego State @ #1 Alabama (06:30 PM ET)",
                      "[Game Thread] #9 Florida Atlantic @ #5 San Diego State (06:09 PM ET)",
                      "[Game Thread] #5 Duke @ #4 Tennessee (02:40 PM ET)",
                      "[Game Thread] #8 Arkansas @ #1 Kansas (05:15 PM ET)",
                      "[Game Thread] #13 Furman @ #4 Virginia (12:40 PM ET)"
                      ))

comments_clean |>
  filter(title %in% selected_games$title) |>
  count(
    min = lubridate::floor_date(time, "5 minutes"),
    title,
    faction,
    # start_date, end_date
  ) |>
  filter(n > 7) |>
  ggplot(aes(x = min,
             y = n,
             fill = faction
  )) +
  geom_col() +
  facet_wrap(~title,
             scales = "free",
             ncol = 2
  ) +
  scale_y_continuous(labels = scales::comma) +
  labs(title = "r/CollegeBasketball Game Thread Timelines\nTotal comments posted per 5 minute interval, by commenter's primary flair",
       subtitle =  "Selected Games from the 2023 Tournament",
       x = "Comment time (5 minute chunks)",
       y = "Total comments",
       fill = "Commenter Faction",
       caption = paste0("Data collected from r/CollegeBasketball using PRAW (https://praw.readthedocs.io/en/stable/)\n",
                        "Allegiance determined by primary flairs only")
  ) +
  ggthemes::theme_fivethirtyeight() +
    # scale_fill_fivethirtyeight() +
    scale_fill_manual(labels = c("Away Team Fan", "Home Team Fan", "Neutral / No Flair"),
                      values = c("#008FD5", "#FF2700", "#A8A8A8")) +
  theme(legend.direction = "vertical",
        axis.text.y = element_text(size = 13),
        axis.title = element_text(),
        plot.title.position = "plot",
        plot.title = element_text(hjust = 0.5),
        plot.subtitle = element_text(hjust = 0.5)
  )
You can see people pouring in to cheer for Fairleigh Dickinson’s big upset of #1 seed Purdue, you can see a huge pop for SDSU’s buzzer beater over FAU in the Final Four, and you can see that the championship game had more comments at halftime than when the confetti fell. It was kind of a snooze, if I’m being honest, and I blame UConn. When KU ended 2022 with a chalky blue blood champion, they at least gave everyone an exciting comeback in the championship game as compensation.
3.3 | Most active fanbases and users
We can also see who the most active fanbases / users are. First, the fanbases:
comments_clean |>
  group_by(flair_one) |>
  summarize(
    n_comments = n(),
    n_users = n_distinct(author),
    avg_comments = n_comments / n_users,
    avg_score = mean(score, na.rm = T)
  ) |>
  filter(flair_one != "No Flair") |> # Not interested in these
  slice_max(order_by = n_comments,
            n = 10) |>
  mutate(
    across(.cols = !flair_one,
           .fns = ~format(round(.x, 2), big.mark = ",")),
    rank = paste0("#", row_number())
  ) |>
  select("Rank" = rank,
         "Primary Flair" = flair_one,
         "Total Comments" = n_comments,
         "Unique Users" = n_users,
         "Comments per User" = avg_comments,
         "Avg. Score" = avg_score) |>
kable()| Rank | Primary Flair | Total Comments | Unique Users | Comments per User | Avg. Score |
|---|---|---|---|---|---|
| #1 | Michigan State Spartans | 10,552 | 548 | 19.26 | 3.28 |
| #2 | Indiana Hoosiers | 7,305 | 385 | 18.97 | 2.81 |
| #3 | Connecticut Huskies | 6,826 | 294 | 23.22 | 3.05 |
| #4 | Kansas Jayhawks | 6,756 | 379 | 17.83 | 3.05 |
| #5 | Kentucky Wildcats | 6,142 | 359 | 17.11 | 2.95 |
| #6 | Maryland Terrapins | 6,045 | 249 | 24.28 | 3.27 |
| #7 | North Carolina Tar Heels | 5,566 | 314 | 17.73 | 2.81 |
| #8 | Purdue Boilermakers | 5,158 | 449 | 11.49 | 2.76 |
| #9 | Illinois Fighting Illini | 5,027 | 258 | 19.48 | 2.86 |
| #10 | Texas Longhorns | 4,856 | 318 | 15.27 | 2.85 |
In first place, with a massive lead at 10,552 total comments despite their modestly early exit, Michigan State flairs were the MVPs of posting on /r/CBB. Congrats to them. The Hoosiers were in second place, and the champs rounded out the top 3.
A very impressive showing by the Spartans, and by the Big 10 generally – I notice that Purdue flairs were the second most numerous in terms of individual posters, but they naturally stopped talking after the tournament really got underway. That leads me to think they would have dominated this leaderboard alongside MSU if not for their unfortunate early exit.
Next, individual posters.
total_n_threads <- n_distinct(comments_clean$title)

comments_clean |>
  group_by(author) |>
  summarize(
    flair_one = flair_one[[1]],
    n_comments = n(),
    avg_score = mean(score, na.rm = T),
    min_score = min(score),
    max_score = max(score),
    n_threads = n_distinct(title),
    p_threads = n_threads / total_n_threads
  ) |>
  slice_max(order_by = n_comments,
            n = 10) |>
  mutate(
    across(.cols = !c(author, flair_one),
           .fns = ~format(round(.x, 2), big.mark = ",")),
    rank = paste0("#", row_number()),
    author = paste0("\\/u/", author)
  ) |>
  select("Rank" = rank,
         "Commentor" = author,
         "Flair" = flair_one,
         "Total Comments" = n_comments,
         "Avg. Score" = avg_score,
         "Min. Score" = min_score,
         "Max. Score" = max_score,
         "Threads Visited" = n_threads) |>
kable()| Rank | Commentor | Flair | Total Comments | Avg. Score | Min. Score | Max. Score | Threads Visited |
|---|---|---|---|---|---|---|---|
| #1 | /u/AFC-Wimbledon-Stan | Auburn Tigers | 740 | 3.45 | -1 | 41 | 49 |
| #2 | /u/fancycheesus | Arkansas Razorbacks | 739 | 3.34 | -1 | 27 | 45 |
| #3 | /u/Ghost-of-Moravia | Maryland Terrapins | 684 | 3.38 | -7 | 19 | 37 |
| #4 | /u/ddottay | Kent State Golden Flashes | 575 | 3.57 | -10 | 46 | 63 |
| #5 | /u/spierce64006 | Indiana (PA) Crimson Hawks | 518 | 2.07 | -7 | 35 | 27 |
| #6 | /u/indreams159 | San Diego State Aztecs | 504 | 3.24 | -3 | 41 | 42 |
| #7 | /u/loyalsons4evertrue | Iowa State Cyclones | 501 | 2.69 | -1 | 16 | 33 |
| #8 | /u/4ngusm4c | North Carolina Tar Heels | 496 | 2.94 | -4 | 33 | 33 |
| #9 | /u/SaintArkweather | Delaware Fightin’ Blue Hens | 491 | 2.92 | -1 | 44 | 45 |
| #10 | /u/That_One_Pancake | Penn State Nittany Lions | 466 | 3.71 | -10 | 47 | 35 |
Wow, people really love posting! People love it so much that the leaderboard is a photo finish – this year’s posting champion, by just a single comment, was Auburn flair /u/AFC-Wimbledon-Stan. In second place just behind was Arkansas flair /u/fancycheesus, and in a relatively distant third was Maryland flair /u/Ghost-of-Moravia. Special shoutout to /u/ddottay for visiting more individual threads than anyone else (they made an appearance in 63 of 67 total threads).
The mean number of comments per user was 12.9, but the median was 3. This is largely because 5,223 (just over 30%) of the nearly 17,000 individual commenters in the dataset only left one comment throughout the entirety of the tournament.
Part the end: the end
There are a million other ways you can look at this data, so this is just a little sampling. Which fanbase swears the most? Who was the most frequently mentioned player or coach? Want to train a ML model that generates game thread comments that are likely to score highly? Now you can, with the awesome power of web scraping and data wrangling with R.