Here’s a quick R script that will retrieve and graph the closing price of BTC-USD every day since its peak.
# create a function to retrieve daily data
retreive_daily_data <- function(pair, start, end) {
url = glue("https://api.pro.coinbase.com/products/{pair}/candles?start={start}&end={end}&granularity=86400")
columnNames <- c('unix', 'low', 'high', 'open', 'close', glue('{pair} volume'))
mydata <- fromJSON(url)
df <- as.data.frame(mydata)
colnames(df) <- columnNames # rename the columns
return(df)
}
bitcoin <- retreive_daily_data(pair = "BTC-USD", start = Sys.Date() - days(300), end = Sys.Date()) |>
# Can only get 300 at a time max
rbind(
retreive_daily_data(pair = "BTC-USD", start = Sys.Date() - days(600), end = Sys.Date() - days(300))
) |>
rbind(
retreive_daily_data(pair = "BTC-USD", start = Sys.Date() - days(800), end = Sys.Date() - days(600))
) |>
mutate(
date = as_date(as_datetime(unix))
) |>
arrange(desc(date))
bitcoin |>
mutate(
delta = close - lag(close),
outcome = if_else(delta > 0, "green", "red")
) |>
ggplot(aes(x = date,
y = close)) +
geom_line(color = "red",
linewidth = 1.5,
alpha = 0.5) +
scale_y_continuous(labels = scales::dollar,
limits = c(0, NA)) +
labs(title = "BTC-USD Closing Price") +
ggthemes::theme_fivethirtyeight()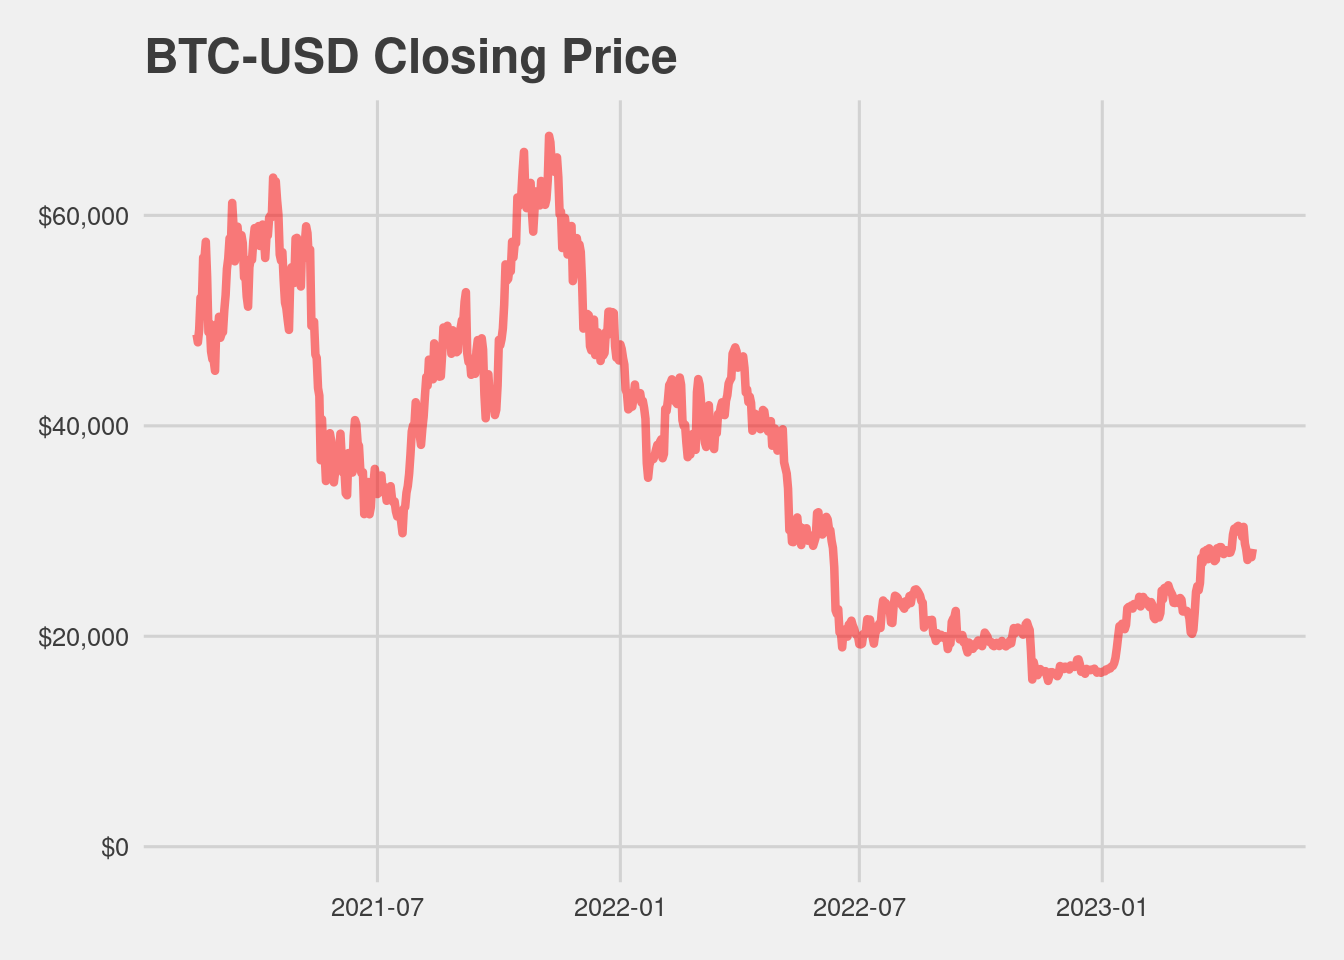
Still so far to fall…